
Economic development typically progresses through three stages: resource-driven, efficiency-driven, and innovation-driven. The Korean economy is classified at the highest stage: innovation-driven. But the means of production still exhibit strong efficiency-driven characteristics, particularly due to the dominant manufacturing sector. In innovation-driven economies, business services generally make up a relatively large share of the service sector, with the wholesale and retail trade industries being somewhat smaller. However, this is not the case in Korea. Furthermore, the so-called commercial and service infrastructure plays a critical role in helping new firms compete in the marketplace against established competitors. But the commercial and service infrastructure is weak in Korea, resembling that of a resource-driven economy (Bahn SS et al. 2014; Bahn SS et al. 2013a). Just as the self-employment rate and employment structure do not match the Korean economy’s overall development level (refer also to Appendix 1.1.2), so the Korean service sector is also weak in various ways.
Based on gross value add in 2014, the service sectors in the US and European countries of the OECD made up 78% and 73.8%, respectively, of total domestic economic value add. On the other hand, this number for Korea was only around 60% (OECD, National Accounts at a Glance).[1] From an employment point of view, 68.0% of all domestic employment (not including the agricultural and public sectors) was active in the service sector,[2] demonstrating not only the absolute impact of the service sector on supporting the lives of most Koreans (OECD 2015b), but also the low sectoral productivity. Service sector productivity in 2014 was 92% of manufacturing productivity in the OECD overall (OECD 2015c) but only 43.5% in Korea (OECD 2015b). Moreover, 2008 labor productivity in Korean services was barely 46.1%, 58.9%, and 63.3% of service labor productivity in the US, Japan, and OECD, respectively (Ministry of Knowledge Economy 2012).
Signs of weakness in the Korean service sector can be found in worker wages as well. In 2014, wages per service worker were just 59.3% of worker wages in manufacturing, with service productivity being 43.5% of manufacturing productivity (OECD 2015b). As shown in Appendix Fig. 2.1.3.1, even though the proportion of Korean service sector workers in the economy did not notably differ from the OECD mean, value add and productivity in the Korean service sector were significantly lower. This points to sluggish Korean service sector innovation. To maintain competitiveness in global markets, Korea needs to foster innovation in the domestic service sector.
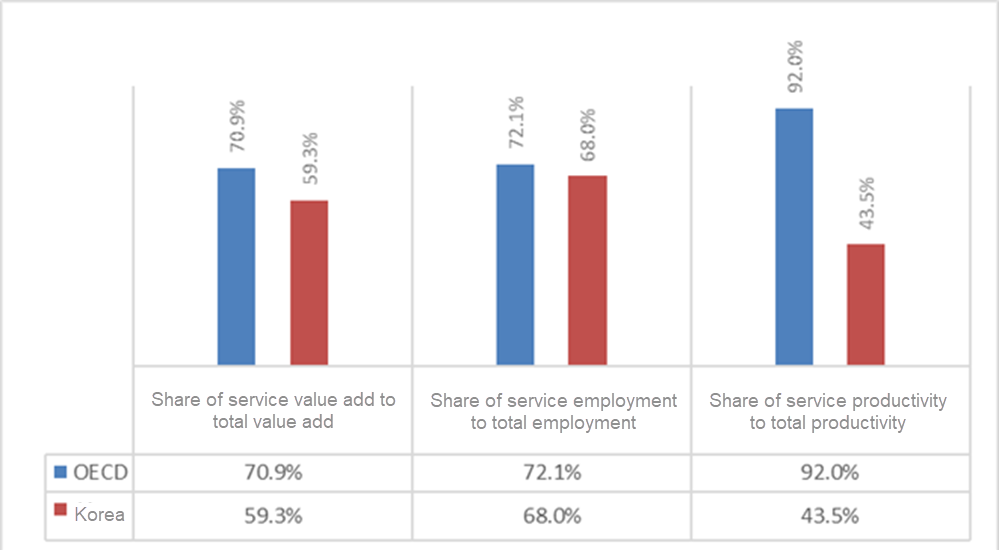
Note: OECD and Korean value added: 2013; OECD employment: 2011; Korean employment, and OECD and Korean productivity: 2014
Source: OECD, 2015b; OECD, 2015c
Appendix Fig. 2.1.3.1. Korean service sector vs. service sectors of other OECD nations
High business start-up and closure rates in Korea suggest the presence of unstable employment conditions. The 14% Korean business start-up rate in 2013 was higher than business start-up rates in most OECD countries. However, between 2006 and 2012, the Korean business closure rate was also very high, as was the 29.2% employer enterprise churn rate in 2012 (OECD 2015a). Suh GH at al. (2014) have found a positive correlation between the business start-up rate and business closure rate in Korea, as well as between the business start-up rate and the unemployment rate. Further, the business start-up rate was negatively correlated with economic growth. In other words, the high start-up and closure rates are indicative of difficult business conditions.
OECD-reported numbers for value add in services (based on three services groupings[3]) over the 2000–2012 period are shown in Appendix Fig. 2.1.3.2. The proportion of value add from these Korean services increased narrowly from a relatively low 56.8% to 57.6% during the respective period. In contrast, this proportion grew by 3.5% in the EU, starting from an already higher level of 69.8%. This suggests that the share of value add generated by Korean services is relatively low and that the service sector is barely keeping up with growth in the general economy. In contrast, the proportion of value add by Korean industry (meaning manufacturing, including energy) rose from 31.6% to 33.8%, while industry’s contribution in the EU dropped from 22% to 19.3%. That is, the relative weight of manufacturing during the period was not only larger in Korea than in the EU but continued to rise faster as well (OECD 2014a).
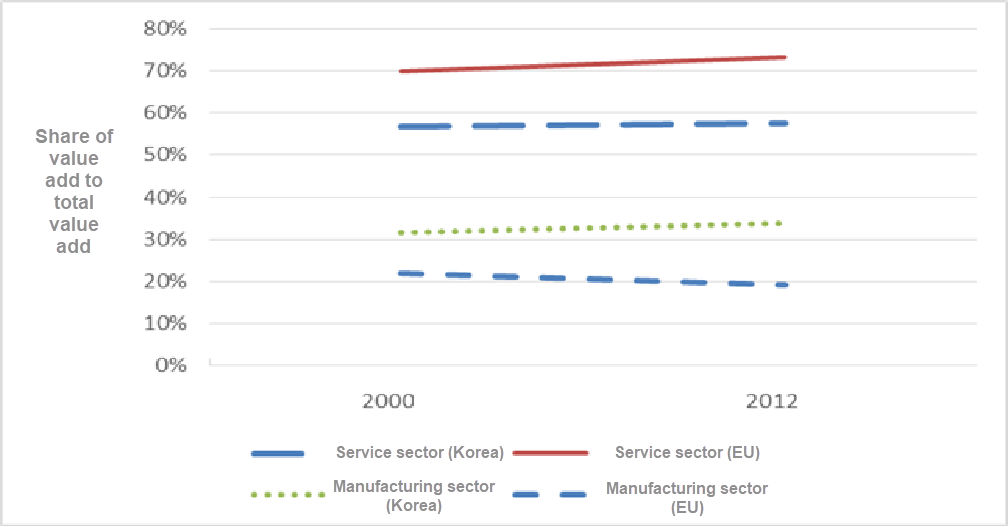
Source: OECD, 2014a
Appendix Fig. 2.1.3.2. Size and growth rates of of service and manufacturing
In service trade, exports from the Korean service sector have languished for a long time. As shown in Appendix Table 2.1.3.1, the share of foreign value add within total Korean exports in 2011 was 41.7%, much higher than the OECD mean. On the other hand, the shares of services to total exports and domestic service value add to total exports were 20.2% and 16.0%, respectively. These are not only much lower than in the OECD overall but also suggest significant deterioration in Korea in both indices between 1995 and 2011 (OECD-WTO, TiVA Database). However, further analysis of individual industries in service trade indicates that conditions in the Korean service sector are not uniform, nor that all service industries are weak. Comparing 2000–2002 to 2012–2014 , the industries contributing the most to Korean service exports include transportation; computer and information services; audio/video and related services; commercial and trade-related services; architecture, engineering and other technical services; and financial services. In contrast, Korea spends far more than it earns on patent rights and other licensing fees; travel; miscellaneous business services; and communication services (Seo HJ 2015; Seo HJ, Lee YS, and Hur JJ 2007).
Appendix Table 2.1.3.1. Cross-country comparative analysis of service exports
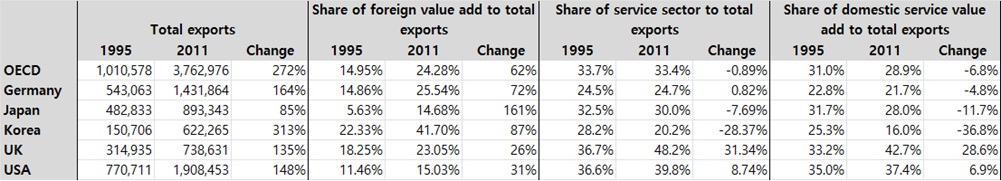
Source: OECD-WTO, TiVA Database
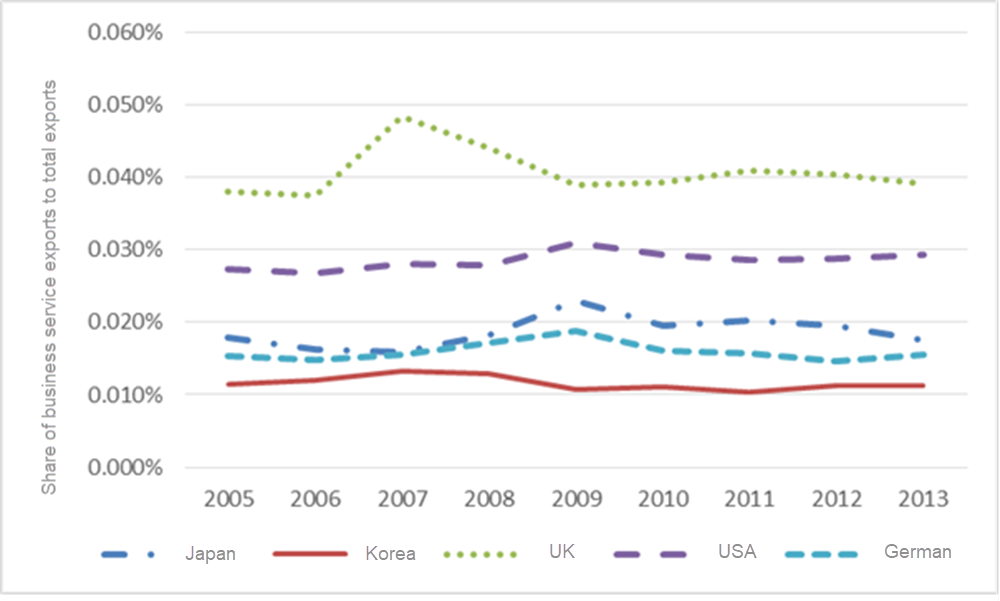
Knowledge services exert significant ripple effects on productivity throughout the economy and also help to drive trade in services. These industries are defined as “services that intensely produce, process, and utilize knowledge, and create high value add through convergence with other industries” (Ministry of Knowledge Economy 2012). Under the section-level classification of the Korean Standard Industrial Code, knowledge service industries includes communications; finance and insurance; business services; education; health and social welfare; and entertainment, culture, and sports (Ministry of Knowledge Economy 2010). Services produced in knowledge-based services are used as intermediate goods in the manufacturing process and support manufacturing (Jang KJ and Choi HJ 2014; Ministry of Knowledge Economy 2012). However, Korean knowledge services are not performing at their potential compared to other major nations for a variety of reasons, including weak demand and industrial base and lack of supply capacity (Park SU 2010; Ministry of Knowledge Economy 2012). For example, even though business services are an important component of information services (Jang KJ and Choi HJ 2014), the business services share of total exports was not only significantly lower in Korea than in other advanced nations, but there has also been no notable change in that proportion over time in Korea (see Appendix Fig. 2.1.3.3).
Source: KOSIS (2016); OECD, National Accounts at a Glance (gross domestic product, GDP (accessed Jan. 29, 2016), gross value added, services, percentage of total activity (accessed Oct. 30, 2016))
Appendix Fig. 2.1.3.3. Business services export trends for individual countries
In Korea, business services are only 63.6% as productive as manufacturing (Statistics Korea, National Accounts and Economically Active Population Survey). Professional, scientific, technical, administration and support services activities, as classified by the OECD, corresponds in part to knowledge services, which includes business services. In 2014, this sector was found to produce 7.45% of gross value add in Korea, but 11.46% in the US and 10.68% in the EU (OECD, National Accounts at a Glance).[4]
While R&D intensity in Korea was 4.1% in 2013—the second highest in the OECD after Israel—the proportion of new products released to the market by Korean service firms was the lowest, at 1.5% (OECD 2015d). In other words, robust R&D activities in Korea are focused outside the service sector and R&D activities that do take place in the service sector are notably inefficient. This is likely related to the types of innovation being conducted by Korean service companies. The OECD’s Oslo Manual defines four types of innovation: product innovation, process innovation, marketing innovation, and organizational innovation (OECD/Eurostat 2005). The most innovative firms promote innovation in not just one type, but in two or more types of innovation simultaneously. However, in services, Korea ranks lowest among OECD nations for product/process innovation and combined product/process innovation and marketing/organizational innovation, while being at the top for marketing and organizational innovation (OECD 2015d). In the same vein, a study comparing service innovation in Korea and the EU found that Korean service firms invested relatively more in on-the-job training and marketing innovation and less on technical innovation than service firms in the EU, and that the educational level of Korean R&D service workers was relatively low (Lee JH 2015).
According to the OECD’s FDI Regulatory Restrictiveness Index, Korean regulations on foreign direct investment in distribution and business services were relatively relaxed compared to the OECD mean, but were more stringent in transportation, media, communications, and financial services. Only Japan and Mexico had higher levels of regulation in transportation, only Canada and Mexico in media, and only Canada in communications (OECD 2014a).
In Korean services in 2012, 95.4% of business entities were microenterprises with 10 or fewer workers. This is higher than the 82.3% share in Korean manufacturing and the 91.4% share in services across 38 countries reporting numbers to the OECD (OECD 2015a). Similar patterns can be found in employment as well. The proportion of Korean service workers employed in microenterprises with nine or fewer workers was 55%, and this is much higher than the 34% mean for the OECD overall. The only OECD country with a higher proportion of service workers laboring in microenterprises was Greece (OECD 2015a).
As shown for nominal per capita value add in Appendix Fig. 2.1.3.4, this number in Korean services (nominal GDP in 2012 divided by total number of job holders in 2013) was not even half the value in manufacturing. Value add in wholesale and retail trade and accommodation and food service (leading traditional service businesses) was only 57% of Korean services overall (Statistics Korea, National Accounts and Economically Active Population Survey).
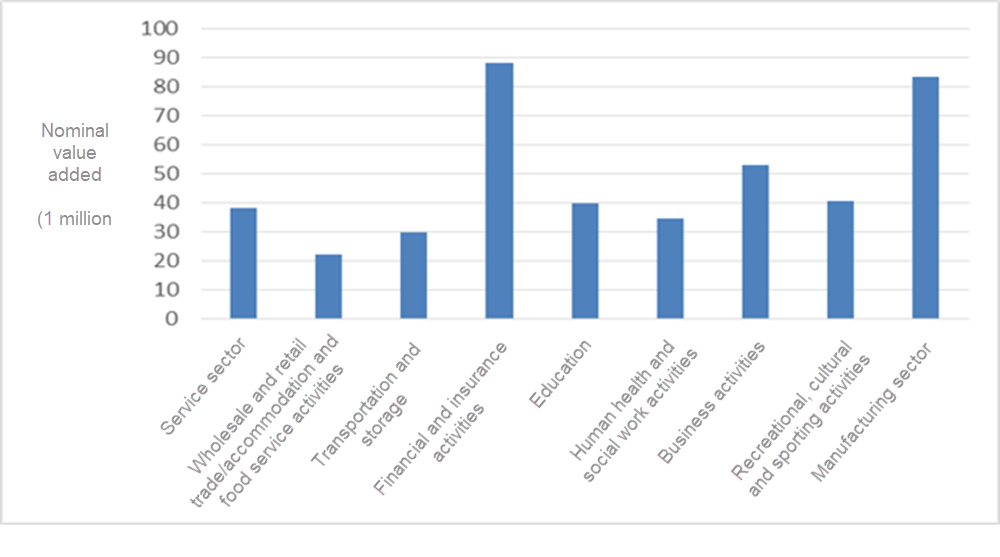
Source: Statistics Korea, National Accounts and Economically Active Population Survey.
Appendix Fig. 2.1.3.4. Korean value add by business type
Conditions in Korea are even weaker in traditional services, business types that include wholesale and retail trade, transportation, accommodation and restaurants, and in which self-employed workers are concentrated (Small Enterprise Development Agency 2013). As shown in Appendix Fig. 2.1.3.5, wholesale and retail trade in Korea also appears feeble in comparison to Japan, which has an economic history, economic structure, and culture similar to Korea. The 2012 self-employment rate in Japan was only 11.8%, but in Korea was 28.2% (OECD 2014a). There was an even bigger gap in wholesale and retail trade: 8.1% in Japan (2007) and 37.1% in Korea (Suh YG and Kim SK 2012; Joo H et al. 2010).[5] Businesses with four or fewer workers made up 93.3% of all retailers in Korea, but just 68.2% in Japan (Suh YG and Kim SK 2012).
As of 2013, the proportion of Korean wholesale and retail trade businesses having a monthly mean operating profit of less than 2 million KRW was 49.0%, with 75.0% of businesses reporting profit of less than 3 million KRW (Small Enterprise Development Agency 2013). Looking only at retail trade in 2010, as many as 25.1% of all businesses were classified as earning nothing or losing money, and 79.8% were not even earning a profit of 2 million KRW per month (Joo H et al. 2010). In the same year, there were 6.4 million workers in the Korean wholesale and retail trade and accommodation and food service industries. Not only did this represent 24.8% of all job holders in the economy, but was also significantly more than 19.4%, the proportion of workers in manufacturing, the core sector of the Korean economy (Statistics Korea, General Economic Survey).
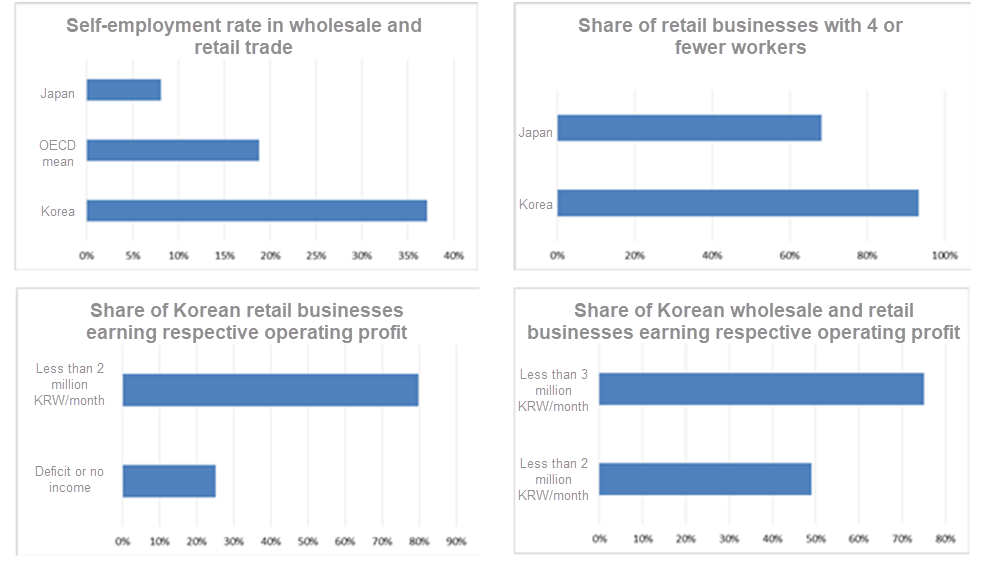
Source: Suh YG and Kim SK 2012; Joo H et al. 2010; Small Enterprise Development Agency 2013
Appendix Fig. 2.1.3.5. Wholesale and retail trade conditions in Korea
Footnotes
[1] Gross value added, Services, percentage of total activity (accessed on Nov. 1, 2016).
[2] The mean share of service sector employment in OECD nations in 2011 was reported at 72.1% (OECD 2015c).
[3] Three categories of the service sector included in this section: 1) trade, transportation, accommodation, restaurants, communication; 2) finance and insurance, real estate, business services; 3) other service activities
[4] Gross value add, Professional, scientific, technical, administration and support services activities, percentage of total activity (accessed Oct. 31, 2016).
[5] The mean self-employment rate in wholesale and retail trade across the OECD (not including Korea) was 18.8% (Joo H et al. 2010).
