
As shown in Fig. 2.1.1, Korea and Japan have experienced the steepest long-term decreases in self-employment. In developed Western countries, such as the United States and Germany, the decline has been modest, while self-employment in the UK has even risen somewhat in recent years from a very low level. The self-employment rate in several developed countries, including the United States and Japan, remained constant or rebounded in the 1970s and 1980s. According to Blau (1987), this was because the attractiveness of self-employment relative to wage earnings improved in line with structural and technological changes in the economy.
Looking at Korea, the drop in the self-employment rate has not been uniform. The decline halted temporarily in the early 1970s and early 1980s when the economy fell into recession. Then, during the 1990s when the self-employment rate remained broadly constant, the Korean economy was entering a phase of lower growth. Early studies of self-employment reveal that the long-term decline in the self-employment rate reversed beginning in the 1990s as workers became more inclined to join the self-employment sector. For awhile, self-employed workers enjoyed increasing business stability, before the self-employment sector began to weaken as it absorbed new workers laid off during the financial crisis near the end of the decade. The rise in the self-employment rate as the Korean economy faced the foreign exchange crisis of 1997–1998 can be understood in this context. In contrast, it is notable that the steady decline in the self-employment rate continued right through the financial crisis of 2008.
Appendix Fig. 2.1.2.1 shows that the 50-year drop in the Korean self-employment rate seen in Fig. 2.1.1 was not the result of fewer workers in the non-wage-and-salary worker sector. Rather, the decline is due to the dramatic increase in the number of total workers and wage-and-salary workers in line with the growing working population and economic growth in Korea. Comparing the ratio of self-employed workers and non-regular employed workers to total employment against that of regular employed workers to total employment as shown in Appendix Fig. 2.1.2.2 reveals a clear and steady decline in the number of self-employed workers and non-regular employed workers. This matches the nearly constant non-wage-and-salary worker population trend in Appendix Fig. 2.1.2.1, demonstrating that the Korean labor market has been improving. In particular, the number of self-employed workers (excluding unpaid family workers) did not fall (refer to first footnote in Appendix 2.2.5).
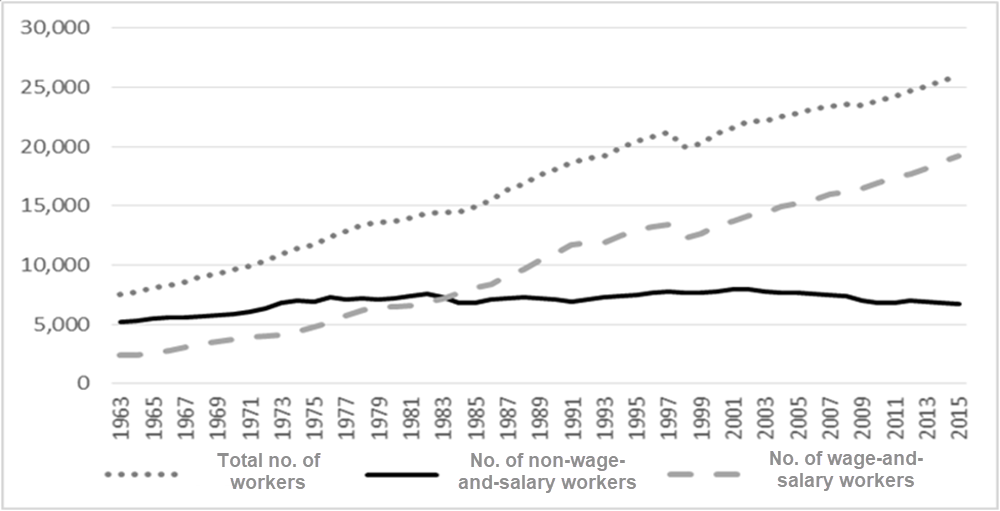
Note: Data includes the agricultural sector.
Source: Statistics Korea (respective years), Economically Active Population Survey (job holders categorized by work status) (accessed Mar. 17, 2016).
Appendix Fig. 2.1.2.1. Trends in number of workers by job type in Korea
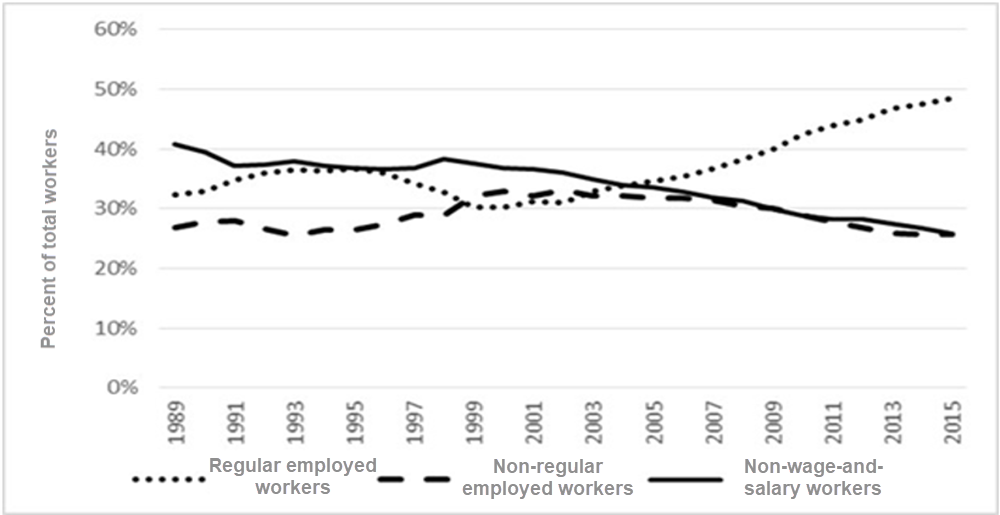
Note: Data includes the agricultural sector.
Source: Statistics Korea (respective years), Economically Active Population Survey (job holders categorized by work status) (accessed Mar. 17, 2016).
Appendix Fig. 2.1.2.2. Trends in regular employed workers, non-regular employed workers, and non-wage-and-salary workers
These trends can also be seen in international comparisons. As shown in Appendix Table 2.1.2.1, changes in the number of Korean self-employment jobs is around the intermediate level among OECD countries reported over the 2007–2014 period. However, from the perspective of self-employment rates, the percentage drop is the largest. This is because of the steep rise in the number of wage-and-salary workers, as illustrated in Appendix Fig. 2.1.2.1.
Appendix Table 2.1.2.1. No. of self-employment jobs and change in the self-employment rate in individual countries
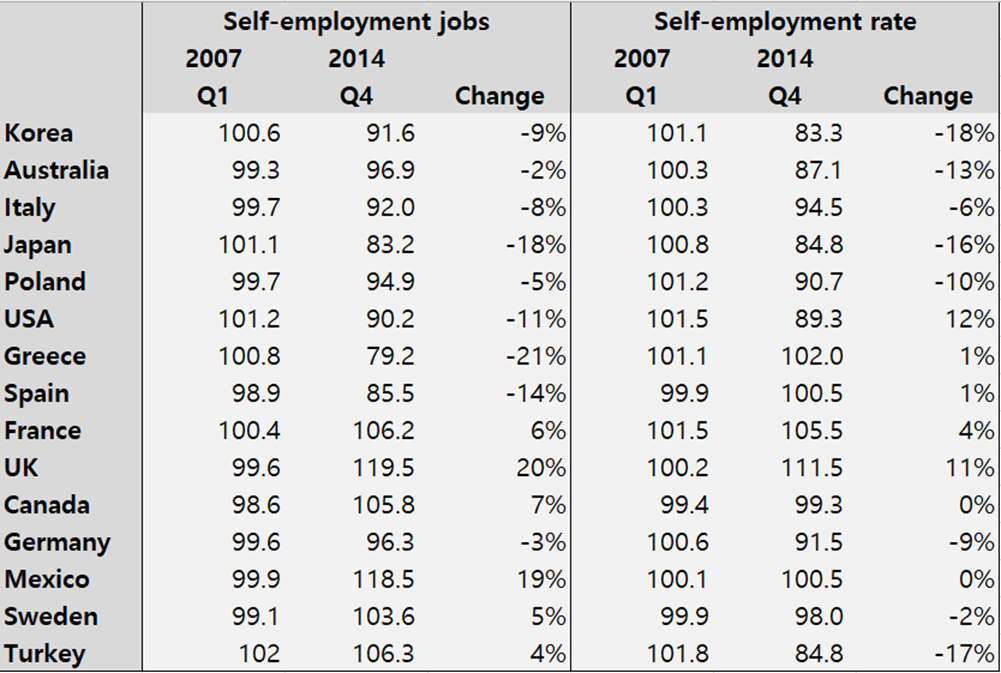
Note: Based on 100 for 2007. Mexico data is from Q1 2007 to Q1 2013.
Source: OECD (2015a)
